mirror of
https://github.com/20kaushik02/real-time-traffic-analysis-clickhouse.git
synced 2025-12-06 07:54:07 +00:00
1.4 KiB
1.4 KiB
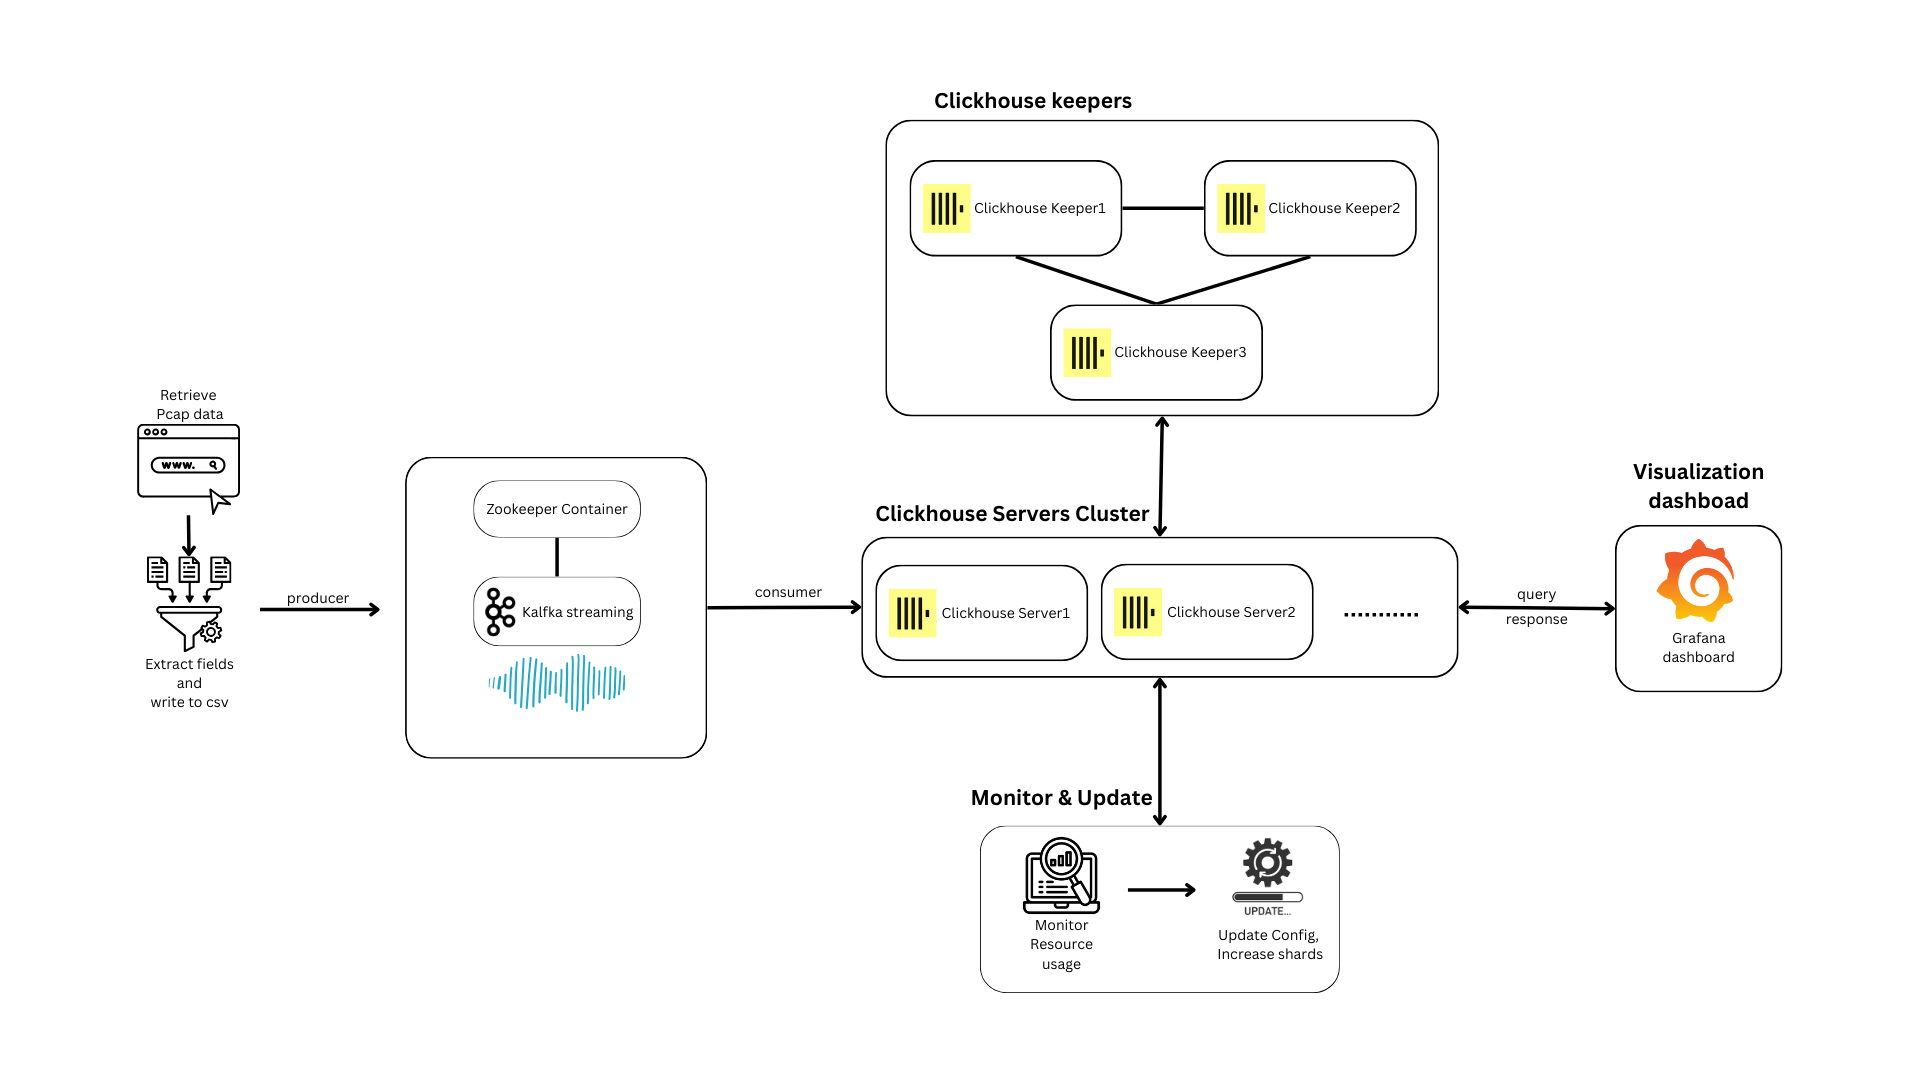
Real-time analytics of Internet traffic flow data
Download the dataset
- The full preprocessed dataset is hosted here - 1.4GB
- Place this file in the
preprocessingdirectory - For testing purposes, you can use the sample CSV that has 10k records from each day instead, change the bind path in the Compose file
To run the project
- From the
scriptsdirectory:- Run
deploy.ps1 -Mfor Windows - Run
deploy.sh -Mfor Linux/macOS (add-Sif sudo needed for docker) - See the
READMEinscriptsfor more
- Run
- This sets up the whole stack
Access the UI
- The Grafana web interface is located at
http://localhost:7602 - Login:
- Username:
thewebfarm - Password:
mrafbeweht
- Username:
- Go to
Dashboards>Internet traffic capture analysis
To run the shard creation and scaling script
- From the
scriptsdirectory:- Install dependencies:
python3 -r ../clickhouse/update_config_scripts/requirements.txt - Run
python3 ../clickhouse/update_config_scripts/update_trigger.py
- Install dependencies:
- This checks every 2 minutes and creates a new shard and two server nodes for it based on resource utilization
Limitations
- For multi-node deployments using Docker Swarm, the manager node needs to be running on Linux (outside Docker Desktop i.e. standalone Docker installation) due to limitations in the Docker Swarm engine